- Analytics
- Technical Analysis
US Dollar Index Technical Analysis - US Dollar Index Trading: 2016-04-14
IMF forecast supports the US dollar
US dollar index edged up despite the weak economic data. Investors may consider the US assets to remain more reliable and profitable in comparison to the other countries’ assets. Such a sentiment may have appeared after the IMF cut the global GDP outlook. The world GDP may be 3.2% this year and 3.5% in 2017 which is 0.2% and 0.1% below the previous IMF outlook. Will the US dollar continue strengthening?
The US economy is to expand by 2.4% in 2016 while the European only by 1.5%, IMF forecasts. Meanwhile, IMF cut the Japan’s GDP forecast twofold to 0.5% for this year and the 0.1% contraction of Japan’s economy is expected in 2017. Given these data, the market participants did not react strongly on the 0.3% fall of US retail sales in March and the 0.1% fall of the producer price index in March since February. Such a negative data pushed the consensus-forecast of US GDP growth down to 0.2% in Q1 2016 from 1.4% in Q4 2015. On Thursday, April 14, at 14:30 CET the US inflation for March will be released. It is expected to increase slightly which may raise the chances for the Fed rate hike and have a positive influence on the US dollar index. On Friday the consumer confidence index by Michigan University will be released, the outlook is positive too.
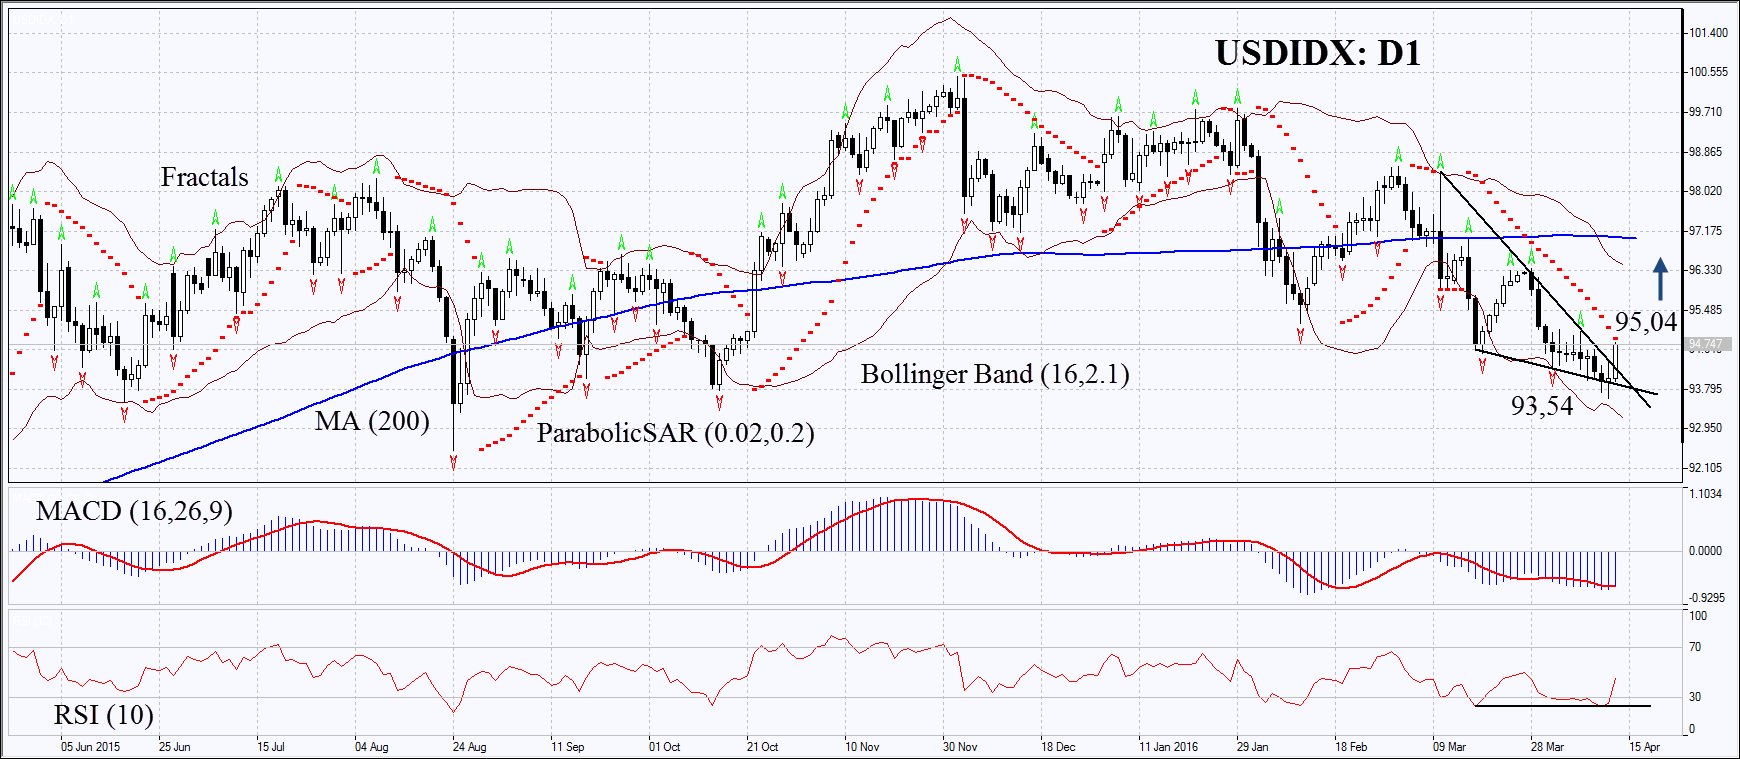
On the daily chart USDIDX: D1 has surpassed the support of the downtrend. The MACD has formed the bullish signals while Parabolic is still giving bearish signal. RSI is neutral and below 50, having formed the positive divergence. The Bollinger bands are not contracting yet which means higher volatility. The bullish momentum may develop in case the dollar index surpasses the last fractal high and the Parabolic signal at 95.04. This level may serve the point of entry. The initial risk-limit may be placed below the last low at 93.54 Having opened the pending order we shall move the stop to the next fractal low following the Parabolic and Bollinger signals. Thus, we are changing the probable profit/loss ratio to the breakeven point. The most risk-averse traders may switch to the 4-hour chart after the trade and place there a stop-loss moving it in the direction of the trade. If the price meets the stop-loss level at 93.54 without reaching the order at 95.04, we recommend cancelling the position: the market sustains internal changes which were not taken into account.
| Position | Buy |
| Buy stop | above 95.04 |
| Stop loss | below 93.54 |
Explore our
Trading Conditions
- Spreads from 0.0 pip
- 30,000+ Trading Instruments
- Instant Execution
Ready to Trade?
Open Account Note:
This overview has an informative and tutorial character and is published for free. All the data, included in the overview, are received from public sources, recognized as more or less reliable. Moreover, there is no guarantee that the indicated information is full and precise. Overviews are not updated. The whole information in each overview, including opinion, indicators, charts and anything else, is provided only for familiarization purposes and is not financial advice or а recommendation. The whole text and its any part, as well as the charts cannot be considered as an offer to make a deal with any asset. IFC Markets and its employees under any circumstances are not liable for any action taken by someone else during or after reading the overview.
