- Analytics
- Technical Analysis
Gold vs Yuan Technical Analysis - Gold vs Yuan Trading: 2020-04-13
XAU CNH Technical Analysis Summary

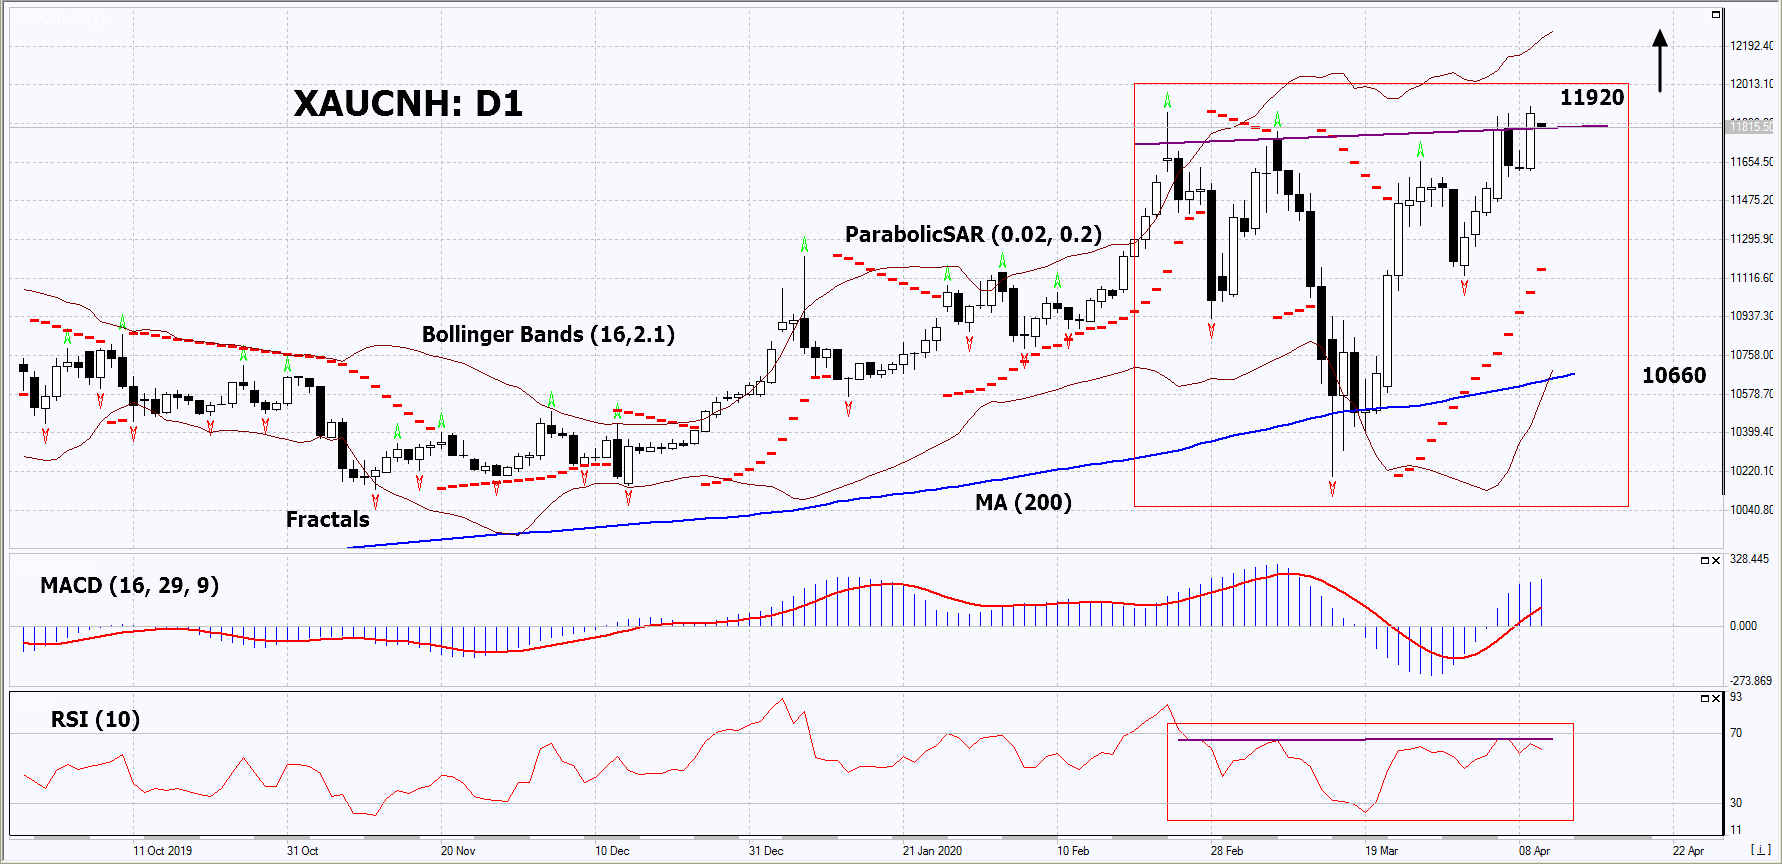
Above 11920
Buy Stop
Below 10660
Stop Loss
| Indicator | Signal |
| RSI | Neutral |
| MACD | Buy |
| MA(200) | Buy |
| Fractals | Neutral |
| Parabolic SAR | Buy |
| Bollinger Bands | Buy |
XAU CNH Chart Analysis
XAU CNH Technical Analysis
On the daily timeframe, XAUCNH: D1 formed the "Inverse Head And Shoulders" graphical price pattern. It may turn out to be a signal of the continuation of the upward trend, and not its reversal. The "Head", or the top of the pattern, leans on the 200-day moving average line. A number of indicators of technical analysis formed signals for the further increase. We do not exclude the bullish movement if XAUCNH rises above its last high and the maximum since September 2011: 11920. This level can be used as an entry point. The stop loss is possible below the Parabolic signal, the last lower fractal, the 200-day moving average and the lower Bollinger lines: 10660. After opening the pending order, we move the stop loss following the Bollinger and Parabolic signals to the next fractal minimum. Thus, we change the potential profit / loss ratio in our favor. After the transaction, the most risk-averse traders can switch to a four-hour chart and set a stop loss, moving it in the direction of the trend. If the price overcomes the stop level (10660) without activating the order (11920), it is recommended to delete the order: market sustains internal changes that have not been taken into account.
Fundamental Analysis of PCI - XAU CNH
In this review, we propose to consider the “Gold vs Yuan” Personal Composite Instrument (PCI). It increases with the rise in the gold prices in the world market and the weakening of the Chinese currency. Can XAUCNH quotes rise?
There are two main factors of demand for precious metals. First of all, they are the risks of a global economic downturn due to the coronavirus pandemic. For example, the international bank JPMorgan Chase estimated the loss of the global economy at $ 5.5 trillion within the next 2 years. The Institute of International Finance expects the world trade reduces by 30% this year. Earlier negative forecasts were issued by OECD, S&P Global Ratings and many others. The second important factor making gold attractive may be the risks of the world major currencies weakening due to an increase in their emissions. The Fed, the ECB, the Bank of England, the Bank of Japan and most other central banks announced stimulus programs for their economies affected by Covid-19. In the US, economic assistance will exceed $ 2 trillion, in the EU - 540 billion euros, etc. Against this background, gold may be in high demand as a protective asset. In turn, the depreciation of the yuan may be caused by lower rates of the Chinese Central Bank and the decrease in the world trade. Next week, important macroeconomic data able to affect the dynamics of XAUCNH will come out in China. Trade balance for March will be published on April 14. And the Chinese GDP for the 1st quarter will come out on April 17.
Explore our
Trading Conditions
- Spreads from 0.0 pip
- 30,000+ Trading Instruments
- Instant Execution
Ready to Trade?
Open Account Note:
This overview has an informative and tutorial character and is published for free. All the data, included in the overview, are received from public sources, recognized as more or less reliable. Moreover, there is no guarantee that the indicated information is full and precise. Overviews are not updated. The whole information in each overview, including opinion, indicators, charts and anything else, is provided only for familiarization purposes and is not financial advice or а recommendation. The whole text and its any part, as well as the charts cannot be considered as an offer to make a deal with any asset. IFC Markets and its employees under any circumstances are not liable for any action taken by someone else during or after reading the overview.

