- Analytics
- Technical Analysis
European Index Technical Analysis - European Index Trading: 2016-03-23
European stock markets
At once several terror attacks happened in Brussels on Tuesday which could have heightened the risks for the European economy. The initial market response was moderate. Nevertheless, a limited speculative downtrend correction may take place in stock markets. Let’s study the performance of the Indices_EU personal composite instrument which is made up from major European stock indices.
The pan-European STOXX Europe 600 Travel and Leisure index fell 2.1%. Other stock market indices remained almost unchanged. Investors still believe the recent expansion of monthly ECB bond-buying programme from 60bn to 80bn euros will improve substantially the financial performance of the companies. The economic data released on Tuesday were neutral. The March manufacturing PMI rose slightly in Eurozone but fell in Germany. The German IFO Business Climate Index edged up while the Economic Sentiment decreased. Till the end of March no significant economic data are expected in EU except for the consumer confidence index in Eurozone on Wednesday and the ECB economic report on Thursday this week.
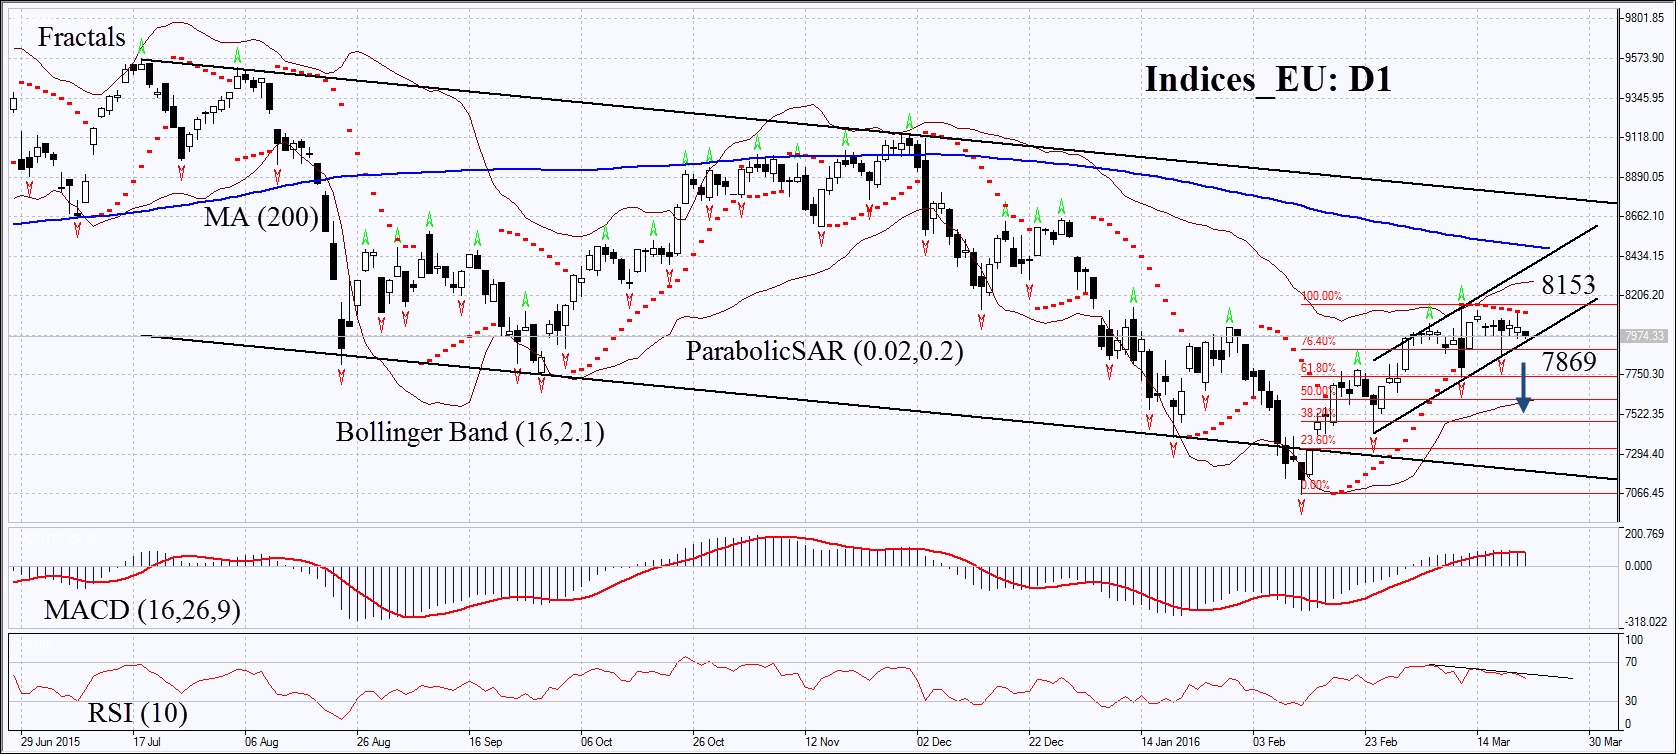
On the daily chart Indices_EU: D1 is in uptrend and has come close to its lower boundary. The prices rose by 15% from the low of August 2013 hit in early February. In the recent two weeks the personal composite instrument has been traded in a narrow range of sideways movement and has approached the support of the uptrend. The MACD and Parabolic indicators give sell signals. RSI is descending and has formed the modest negative divergence. The Bollinger bands have contracted which means lower volatility. The bearish momentum may develop in case the chart Indices_EU falls below the last fractal low, first Fibonacci retracement level and support of the ascending channel at 7869. This level may serve the point of entry. The initial risk-limit may be placed above the Parabolic signal and the last fractal high at 8453. Having opened the pending order we shall move the stop to the next fractal low following the Parabolic and Bollinger signals. Thus, we are changing the probable profit/loss ratio to the breakeven point. The most risk-averse traders may switch to the 4-hour chart after the trade and place there a stop-loss moving it in the direction of the trade. If the price meets the stop-loss level at 8153 without reaching the order at 7869, we recommend cancelling the position: the market sustains internal changes which were not taken into account.
| Position | Sell |
| Sell stop | below 7869 |
| Stop loss | above 8153 |
- Get Certificate

Note:
This overview has an informative and tutorial character and is published for free. All the data, included in the overview, are received from public sources, recognized as more or less reliable. Moreover, there is no guarantee that the indicated information is full and precise. Overviews are not updated. The whole information in each overview, including opinion, indicators, charts and anything else, is provided only for familiarization purposes and is not financial advice or а recommendation. The whole text and its any part, as well as the charts cannot be considered as an offer to make a deal with any asset. IFC Markets and its employees under any circumstances are not liable for any action taken by someone else during or after reading the overview.
