- Analytics
- Technical Analysis
Brent Crude Oil Technical Analysis - Brent Crude Oil Trading: 2016-01-25
Cold spell supports oil
On Friday the global oil prices edged up more than 6% due to the brisk demand on residual oil amid cold spell in Europe and US. The daily prices growth was after their record 25-year fall in January so market participants see it as correction. Will oil prices continue rising? Let’s study the European oil grade – Brent.
Since the start of the year the Brent oil prices slumped 24% hitting a fresh record low since 2003. The main reason was the supply glut in global markets which formed in 2014 due to the US shale plays development. These days the Western countries have lifted the international economic sanctions against Iran. The IEA expects the oil production to increase by 0.6bn barrels a day and the global oil demand to surpass the supply by 1.5 mln barrels a day in the first half of 2016. Meanwhile, the Iran’s officials stated they were planning to increase the oil production by scarce 0.5mln barrels a day. In theory, they may postpone it till they regain access to the state funds frozen in foreign banks. All these factors postpone the flood of Iran’s oil to the global markets supporting the oil prices. IEA forecasts the global oil demand will increase 1.2mln barrels a day in 2016. The key factor of price growth is the cold spell in Europe and US. The US National Weather Service estimates the snowfall total may surpass 61cm in Washington while in the West Coast region it may edge up to 75cm. Low oil prices made the Canada’s shade oil companies lose $15 per each barrel sold and the production is maintained only by money loans. The same story is in Venezuela and Columbia. According to the Wood Mackenzie consultancy, the oilfield development projects to the gross value of $380bn have been frozen since 2014. So, the further massive oil production build-up is unlikely. Nevertheless, the demand may contract in case of the global economic slowdown. Such concerns may put the brakes on the oil prices rebound.
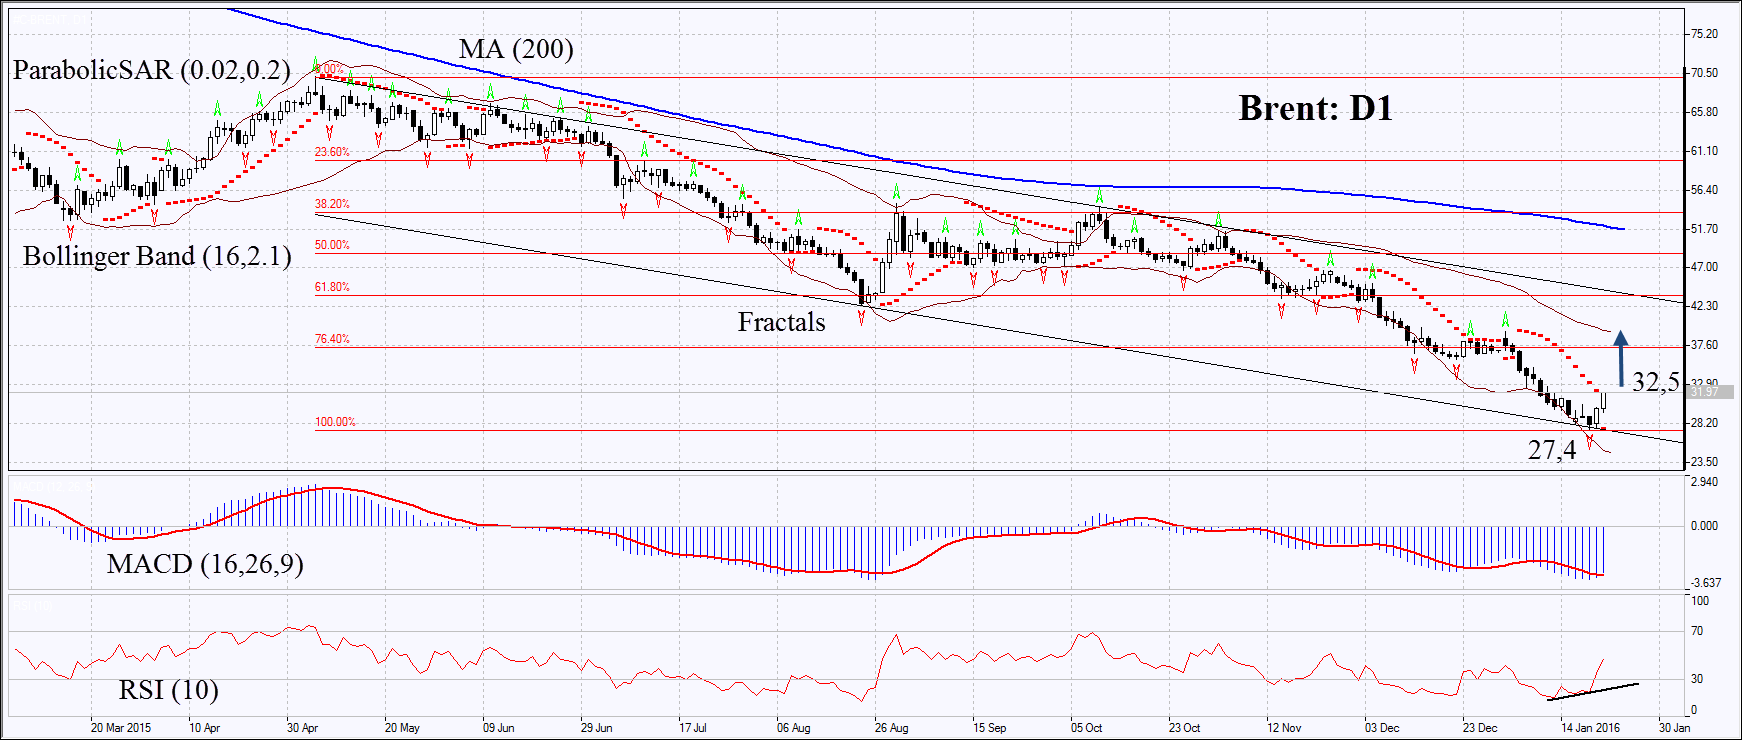
On the daily chart Brent: D1 has verged the support of the long-term descending channel and the 13-year low. It failed to break down through it and began correcting upwards. The Parabolic and MACD indicators give buy signals. RSI has left the oversold zone and formed the positive divergence but has not yet reached the level of 50. The Bollinger bands have widened which may mean higher volatility. The bullish momentum may further develop in case Brent surpasses the last upper Parabolic signal at 32.5. This level may serve the point of entry. The initial risk-limit may be placed below the 13-year low and the last fractal low at 27.4. Having opened the pending order we shall move the stop to the next fractal low following the Parabolic and Bollinger signals. Thus, we are changing the probable profit/loss ratio to the breakeven point. The most risk-averse traders may switch to the 4-hour chart after the trade and place there a stop-loss moving it in the direction of the trade. If the price meets the stop-loss level at 27.4 without reaching the order at 32.5, we recommend cancelling the position: the market sustains internal changes which were not taken into account.
| Position | Buy |
| Buy stop | above 32.5 |
| Stop loss | below 27.4 |
Explore our
Trading Conditions
- Spreads from 0.0 pip
- 30,000+ Trading Instruments
- Instant Execution
Ready to Trade?
Open Account Note:
This overview has an informative and tutorial character and is published for free. All the data, included in the overview, are received from public sources, recognized as more or less reliable. Moreover, there is no guarantee that the indicated information is full and precise. Overviews are not updated. The whole information in each overview, including opinion, indicators, charts and anything else, is provided only for familiarization purposes and is not financial advice or а recommendation. The whole text and its any part, as well as the charts cannot be considered as an offer to make a deal with any asset. IFC Markets and its employees under any circumstances are not liable for any action taken by someone else during or after reading the overview.

